This month we have a guest blog post from Dave Fernandez, CFP® who is a native of Arizona and has over 20+ years of experience. He started his financial services career in 1995, is a NAPFA Registered Financial Advisor and is the owner of a fee only financial planning and wealth management firm, Wealth Engineering, located in Scottsdale.
Survivorship Bias
Sports fans love to compare the sports heroes of their childhood era to current athletes and make a claim on who was the best ever. In many sports this claim on who was the best athlete of a particular time period can be subjective at best. However, baseball is one sport that allows for such a comparison because there are so many years of statistics for past and present athletes. But, what if the statistics were flawed because the data had been manipulated? Wouldn’t this ruin the fun in attempting to determine the “best ever?” As you will see in this article, unlike the baseball figures which are real, the statistics in the mutual fund world have been massaged to make “active” management of mutual funds appear to be better than the actual results.
In the sport of Major League Baseball the current batting averages for most professionals are between .260 to .275. Anyone who hits .300 or better is considered an excellent baseball player. A hitter below .250 would be considered poor and below .200 would be considered unacceptable. A hitting average of .400 or better is truly elite status. Hitting .400 or better is such a difficult accomplishment that the last time it occurred was 1941. Ted Williams playing for the Boston Red Sox ended his season in 1941 with a batting average of .406 – a phenomenal accomplishment.
We recognize how amazing Ted Williams’ achievement was because we can compare his batting average or statistics against his peers, past and present. But, what if baseball did not include all of the batting averages over the last 145 years? Wouldn’t this greatly affect the mean batting average? What if they only included the averages above .275? How would you really know who was a great player if you could not compare them against every player that has ever stepped foot on the field? If baseball did exclude many players’ batting averages you would conclude that all players hit above .275.
Certainly this may not take away a lot of esteem from Mr. Williams, since he has had the highest batting average over the last 75 years. However, there would be a lot of current players that would look like very poor performers, when compared to the long-term averages. In reality, players would not be poor performers, but when compared against an average that had been manipulated, they would appear to be.
Fortunately the sport of baseball does not alter the data. Unfortunately, the game of mutual fund investing does. In fact, many players, i.e. mutual fund managers, are not included at all. It leaves the individual investor to believe that there is nothing but a bunch of .275 plus hitters in the investing league, when in reality, there are numerous hitters below the .275 mark. They just exclude their records.
This flaw in the mutual fund data is known as “survivorship bias.” If one were not aware of this missing data, one could mistakenly believe active managed mutual funds are generally superior to index funds, when in fact, the opposite is generally true. In addition, actively managed funds generally cost 3 to 10 times as much compared to low cost index and passively managed fund options. Thus you could end up greatly over paying for an investment product that has a higher probability of underperforming over the long run.
Survivorship Bias
This “bias” effect has a huge impact on the long term performance records of actively managed equity mutual funds. Mutual funds that have poor performance are made to disappear, most often by the mutual fund company merging a poor performing fund into a better performing one. Unfortunately for investors, only the performance reporting disappears, not the poor returns.
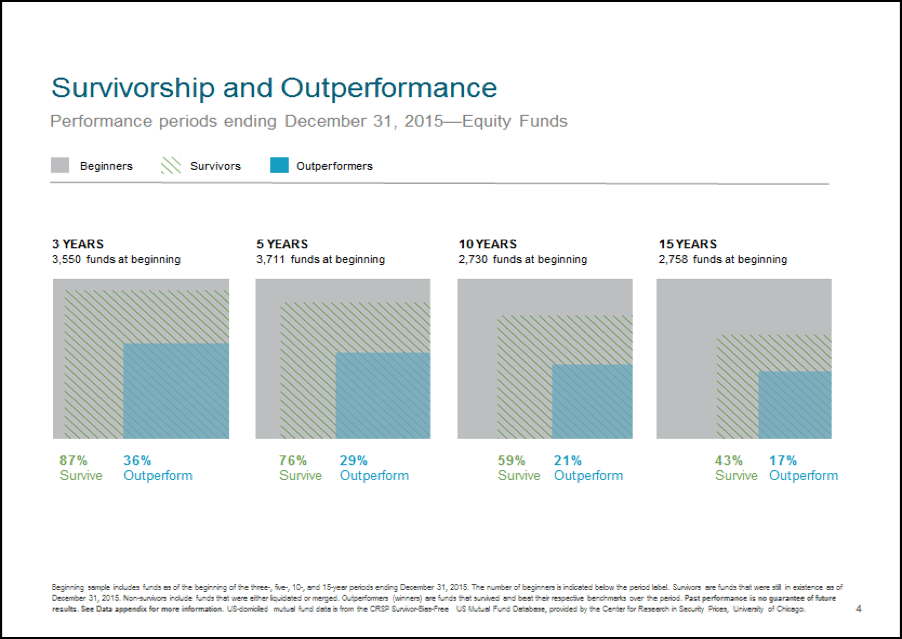
Dimensional Funds (DFA) recently conducted a study over the last 15 years with a sample of 4,500 stock and bond mutual funds, representing approximately $6.6 trillion of wealth. The chart below shows the percentage of equity funds that have survived over the last 3, 5, 10 and 15 year time periods. It is amazing to see the amount of funds that disappeared over the last 15 years, most of them due to poor performance. For example, if you look at the bottom right square, representing the 15 year time period, you can see that only 43% of the mutual funds over that time period survived. That means 57% disappeared!
Why Survivorship Bias Is So Important
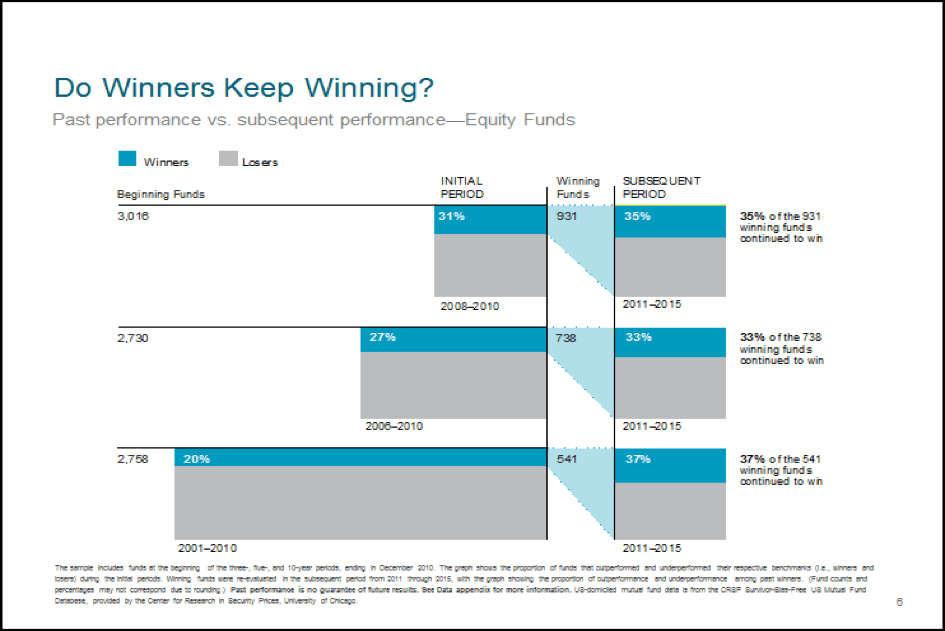
So why is “survivorship bias” so important? It illustrates how competitive and difficult it is to outperform a benchmark consistently and repetitively over a long period of time. Those funds that are not competitive are quietly set aside and closed down. It is also a good reminder that trying to pick a winning mutual fund manager can be a futile effort. In baseball, a hitter with a solid batting average tends to repeat their performance in the future. That is not often the case for mutual fund managers. As you can see below, using the same data reporting period from DFAs study, only about 1/3 of high performing equity mutual fund managers were able to repeat their above average performance with any consistency. Note, this chart needs to be read carefully as that is approximately 1/3 of the “winning” portion of the mutual fund sample, which equates to less than 10% of each sample size. This “winning” performance continues to decrease with each additional length of time measurement as it is incredibly difficult to outperform the market on a consistent basis from year to year. This is further evidence that the probability of a mutual fund manager outperforming their benchmark is highly unlikely the longer time goes on.
The Impact of Costs
One of the greatest benefits of index funds and exchange traded funds (ETFs) are their low costs. Keeping costs low allows more return to remain in the investor’s portfolio versus going to the mutual fund company. Ironically, the “all in” cost to run an actively managed mutual fund, including the sales and marketing overhead required to promote and distribute the fund, many times becomes one of the greatest hurdles subtracting from performance. That extra 1%+ in expenses eats away at returns and has a cumulative effect the longer time goes on.
Below is another chart from DFA’s study showing the great impact a higher cost structure via the expense ratio of a fund has on long-term performance. The general trend is that the quartile of the lowest cost funds tended to have the highest long-term relative performance when compared to the more expensive quartile’s of funds over 5, 10 and 15 years.
The Impact of Turnover
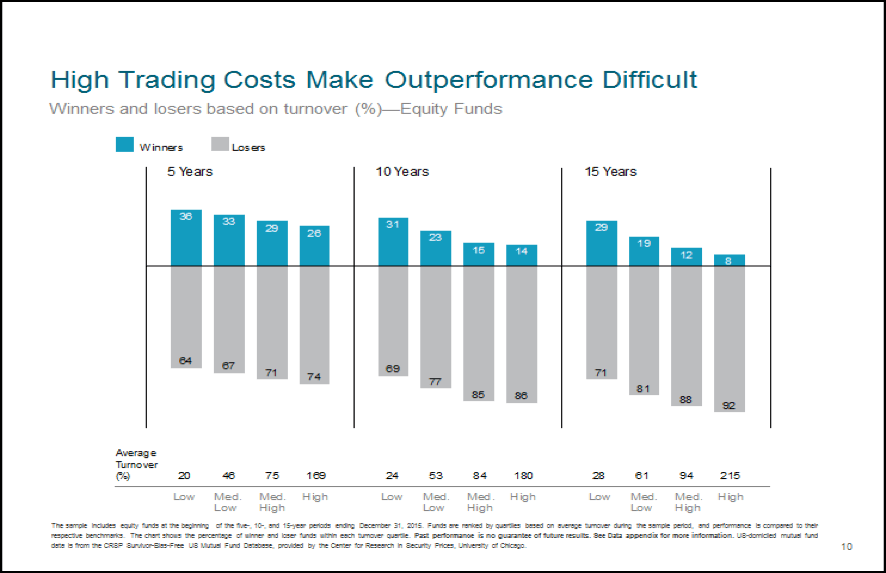
Index funds by nature have low turnover. An index fund manager’s goal is to track a particular index, for example the S&P 500. Thus he or she is not actively trading in and out of various stocks because their goal is to replicate a benchmark at a low cost rather than attempting to outperform it. The benefit to this strategy is that stock turnover in the fund is low. Lower stock turnover generally correlates to lower overall costs as there are less brokerage costs and less exposure to bid-ask spreads. Below is a chart from DFA’s study outlining the impact of high trading costs. Similar to the previous chart of high expense ratios, the quartile of funds with high trading (turnover) costs tend to underperform the longer the time period of measurement.
Conclusion
Certainly we have seen some great “investment heroes” in our time – Peter Lynch, Bill Gross, Bill Miller, Jeffrey Gundlach and Warren Buffett for instance. But how many others have failed trying to follow in their footsteps? Survivorship bias tells us that the number is quite large. Even if you found an active manager who demonstrated above average past performance, how do you know it will consistently continue? As well regarded as Bill Gross and Bill Miller are, they both have had their share of challenges since 2008 for example.
In addition, what if something happens to the investment manager? What if they decide to walk away from the game while they are ahead – just as Peter Lynch did after an outstanding performance record managing the Magellan Fund at Fidelity. What if their investment style goes “out of style?” Or, what if they start making the wrong stock picks or overweighting/underweighting the wrong sectors?
As you can see, being able to predict who will be the next Ted Williams of the investment world is next to impossible to determine. The chances of underperforming an index benchmark such as the S&P 500 only grows greater with time. That is why Wealth Engineering continues to recommend index funds, ETFs and passively managed mutual funds from firms such as DFA or Vanguard, as the core holdings of our portfolios. We can’t predict which mutual fund manager will be the next hero, but we can enhance the probability of our clients being able to meet their financial life goals by constructing globally diversified portfolios using index funds, which provide great diversification and high tax efficiency at a low cost.
About The Author
Dave Fernandez, CFP® is a native of Arizona and has over 20+ years of experience. He started his financial services career in 1995, is a NAPFA Registered Financial Advisor and is the owner of a fee only financial planning and wealth management firm, Wealth Engineering, located in Scottsdale.
Website for Wealth Engineering, LLC
http://www.wealth-engineering.com/